![]()
DPS923 & MAP523
Mobile App Development for iOS
Notes Topics Weekly Resources Graded work Professor Code examplesiOS app debug intro
In this document, you will have a gentle introduction to debugging an iOS app.
Gentle introduction to debugging
As you would expect, Xcode has a debug feature.
To start the debug feature, build and run the app. The debug area is at the bottom of the middle editor area. It may not be visible until you either show it or a runtime error happens.
You can show or hide the debug area with this keyboard shortcut:
Shift+Command+Y
Some of the content that follows was adapted from the debug topics in the Xcode Help documentation.
Debug area overview
The three main components of the debug area include the debug bar, the variables view, and the console.
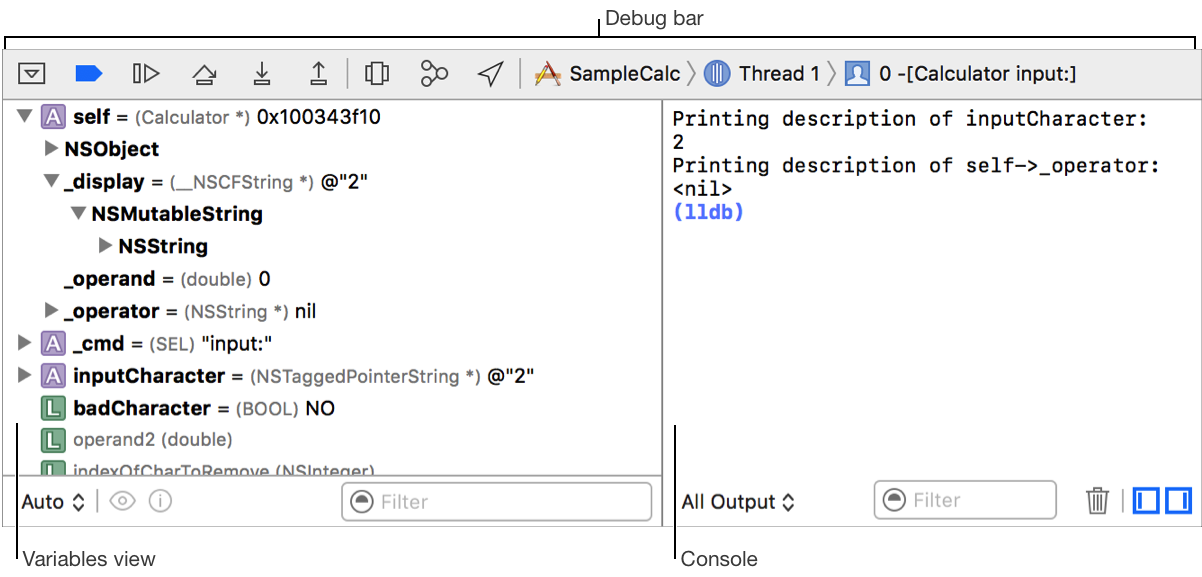
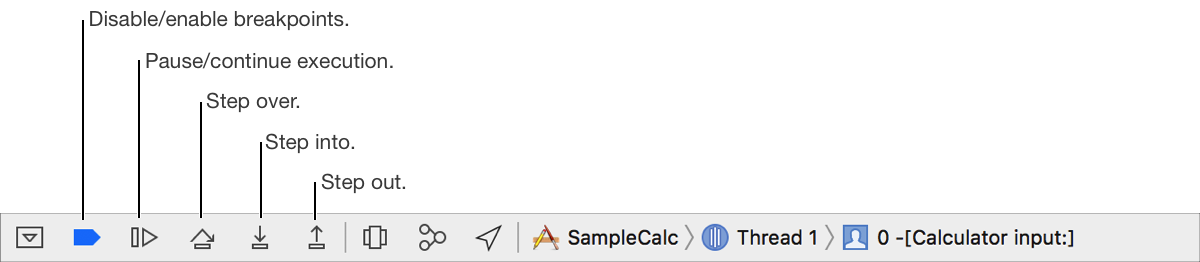
The debug bar contains buttons that disable or enable all breakpoints, control the execution of your app, enable graphical debugging of view and memory state, simulate location, and jump to stack frames.
The variables view presents the list of variables available to inspect in the scope of your present location in the code. This list is a disclosable hierarchy, revealing the values of all parts of a variable’s structure as you progressively expand the disclosure triangles.
The console contains an interactive Terminal-like text area. You use it to interact directly with LLDB, see output from use of Print Description, and work with standard input and output from your app.
The debug bar in the debug area lets you control the execution of your running app. The debug area automatically opens when you build and run your app. (More info…)
Get the sample app
From the code example repository, get the AppWithErrors project. It’s in the Week 2 folder.
View variables
You can view the contents of variables. Your professor will demonstrate this technique.
For more information, see the Xcode Help document.
Manage breakpoints
Breakpoints can be added or removed in a source code file, or by using the breakpoints navigator. Your professor will demonstrate this technique.
For more information, see the Xcode Help document.
Add a catch-all exception breakpoint
Some runtime errors are not so easy to find in the debug area, because they’re caused by something deeper in the framework or foundation code. (That code is good-quality error-free code, but errors can happen when bad data and/or a problematic execution context exists.)
As a result, it’s a good idea to add an “exception breakpoint” to your project. If an error happens, execution will stop just BEFORE the problem code is executed. Then, you can see what code is being run, and you can step through the statements.
This section of the Xcode Help document shows how to add an exception breakpoint, but here is the brief how-to:
- In your project, in the Breakpoints Navigator, click the add icon (plus + sign) at the bottom.
- Choose “Exception Breakpoint”. Accept the defaults by clicking outside the popup (or by pressing the Esc key).